Introduction In modern agriculture, the difference between a good harvest and a great one often lies in the details. For generations, farmers have relied on instinct and experience. Today, we augment that wisdom with a new tool: Data.
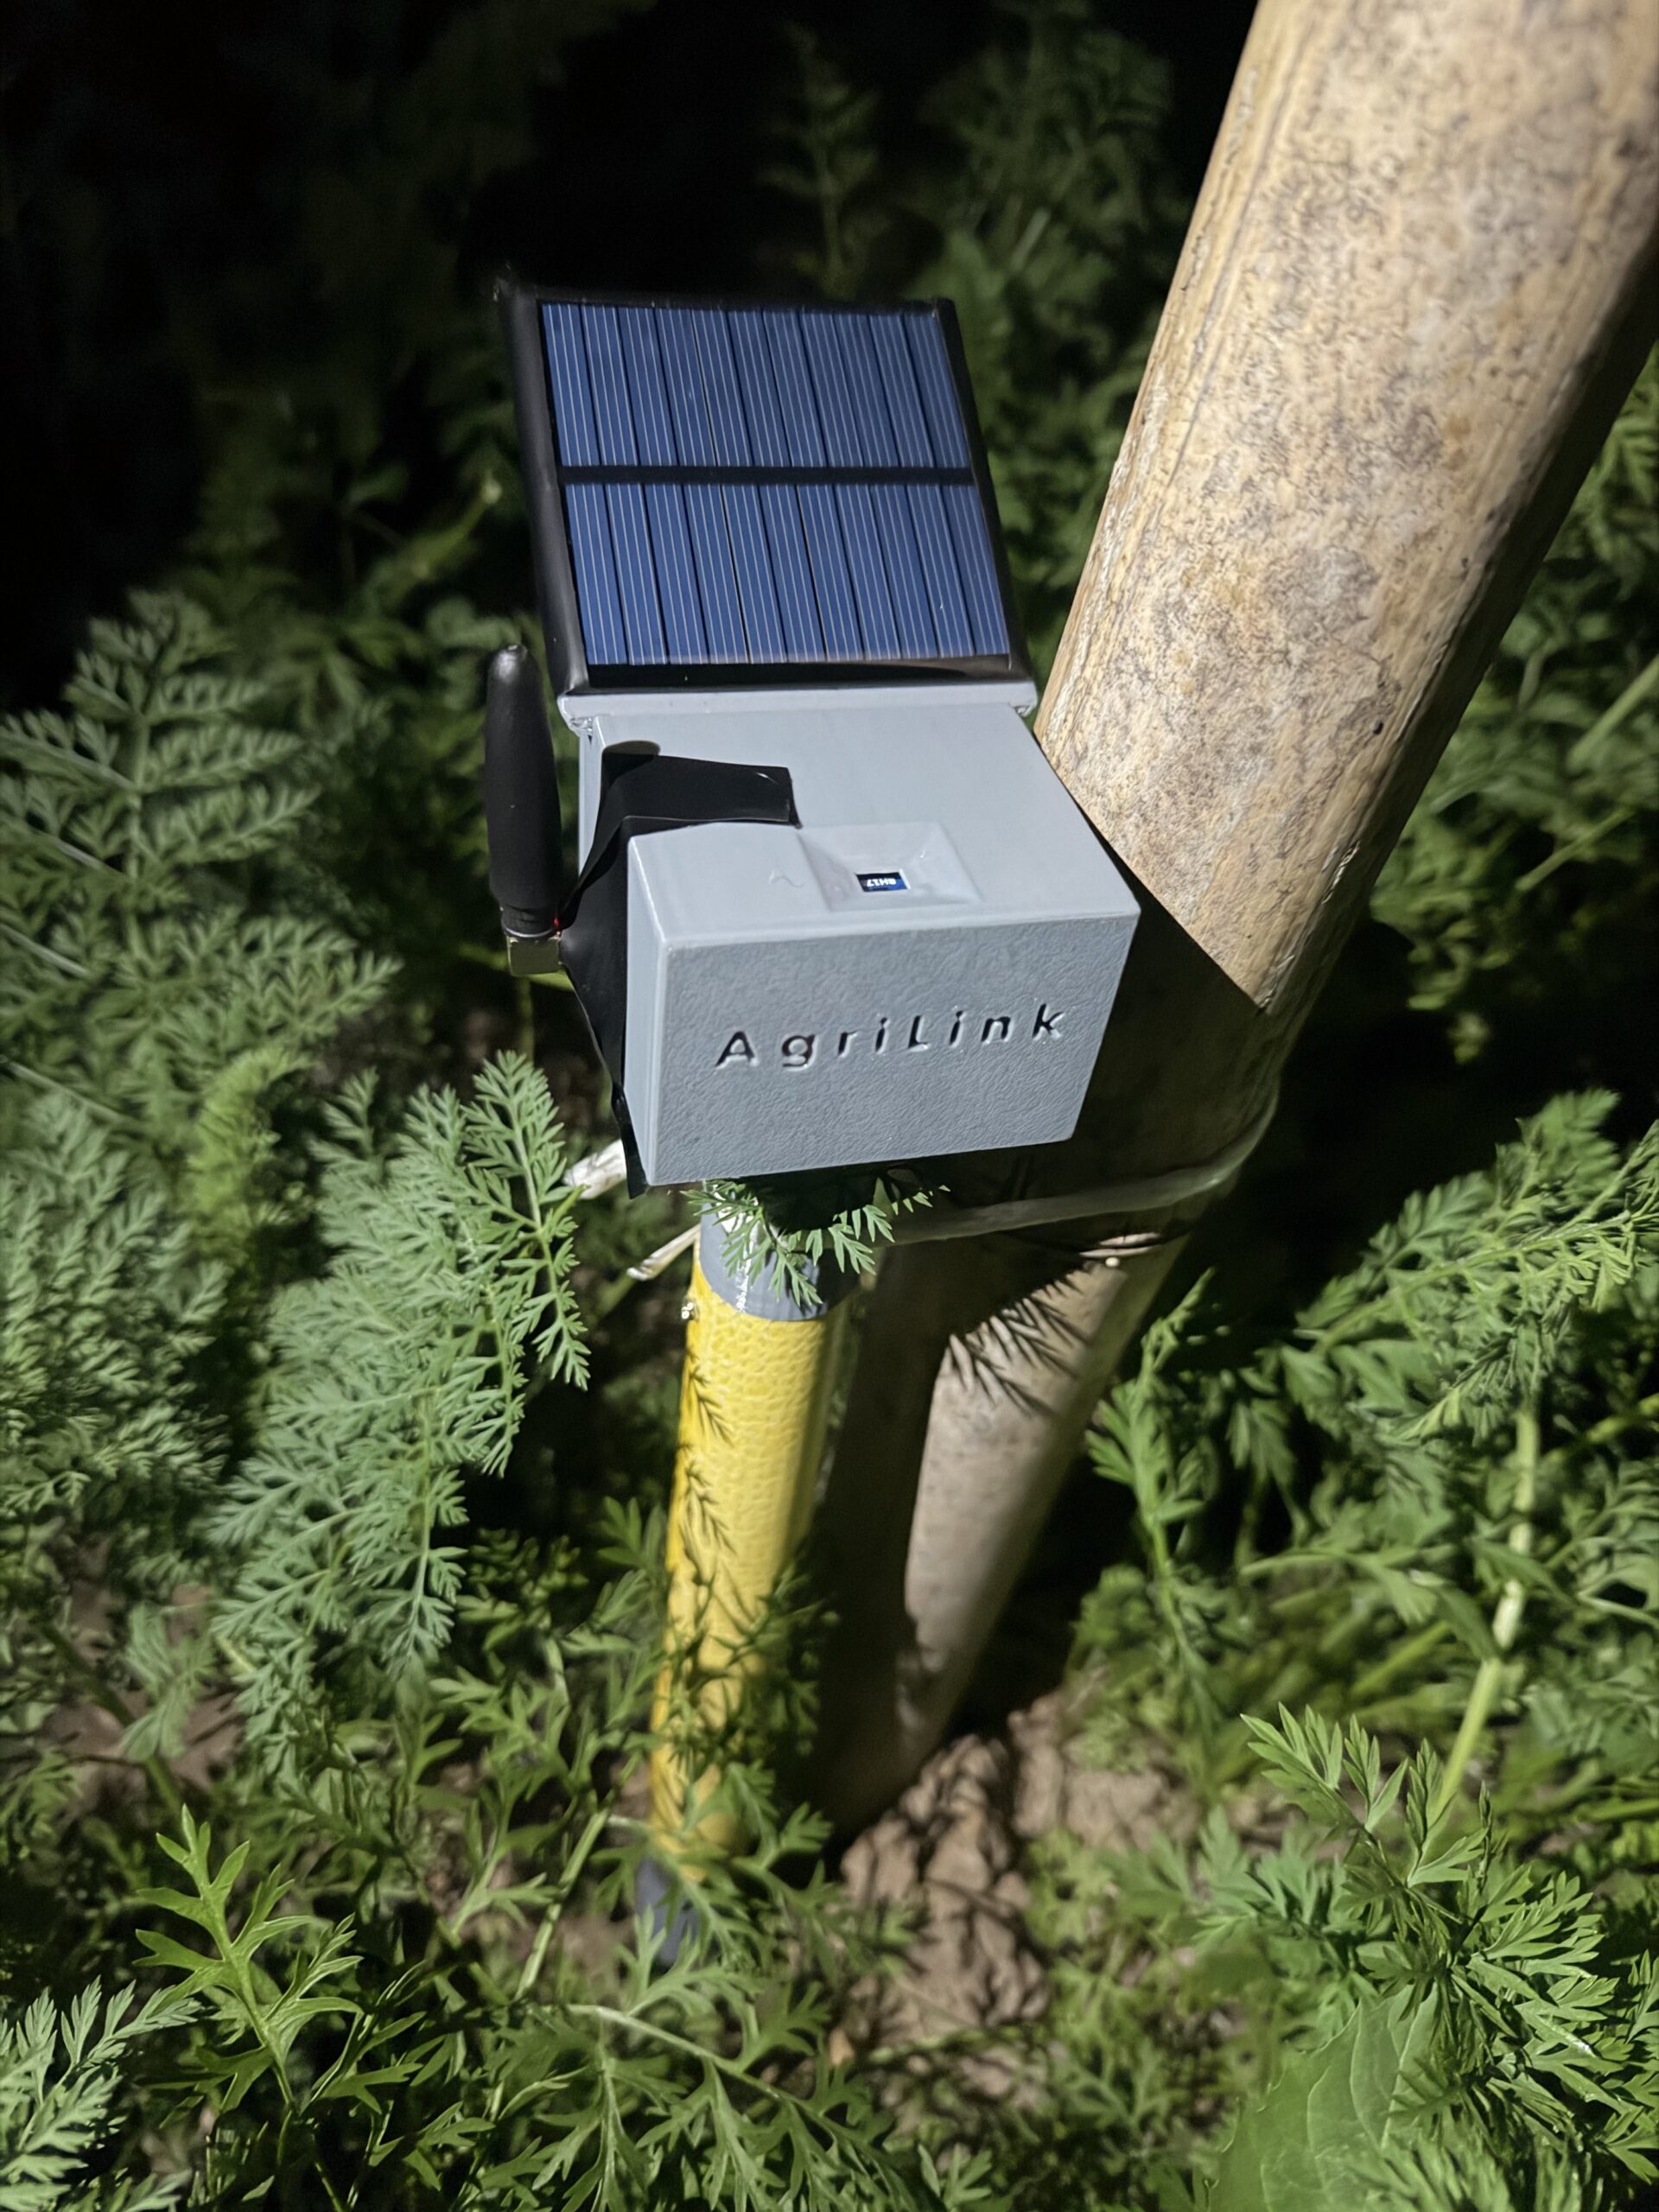
We deployed a network of IoT sensors (Nodes) to monitor the heartbeat of the field in real-time. By analyzing the data collected from December 12, 2025, we can demonstrate exactly how “listening” to your crops can lead to smarter decisions, reduced waste, and optimized growth.
Let’s dive into what the data tells us.
1. The Pulse of the Farm: Temperature & Humidity Dynamics
The most immediate actionable insight comes from understanding the microclimate. Generic weather forecasts cover a whole region; our sensors tell you exactly what is happening at the leaf level.
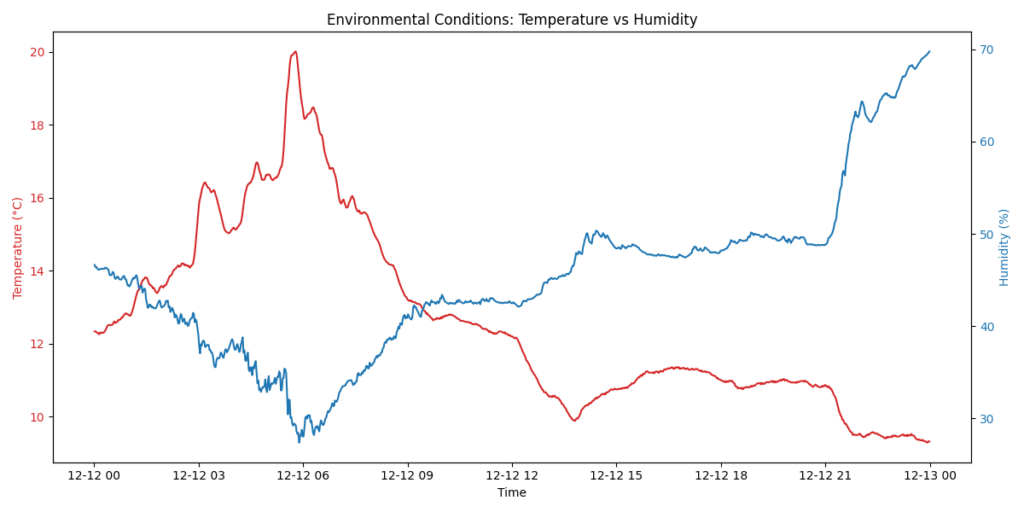
(See Figure 1: Environmental Conditions)
Analysis: The data reveals a clear diurnal cycle where temperature (Red) and humidity (Blue) mirror each other perfectly.
- Observation: As temperatures peak around 20°C, humidity drops to near 27%. Conversely, as nights cool down to 9.3°C, humidity recovers.
- Farmer’s Takeaway: This precise tracking allows for automated alerts. If the temperature drops too fast, frost protection systems can trigger automatically. If humidity stays too high for too long, you receive an early warning for potential fungal disease outbreaks (like Powdery Mildew) before they become visible to the naked eye.
2. The Professional Edge: Vapor Pressure Deficit (VPD)
Advanced growers know that Temperature and Humidity alone don’t tell the whole story. The “secret sauce” of precision agriculture is VPD (Vapor Pressure Deficit). This metric measures the “drying power” of the air—essentially, how much pressure the atmosphere is putting on the plant to transpire (sweat).
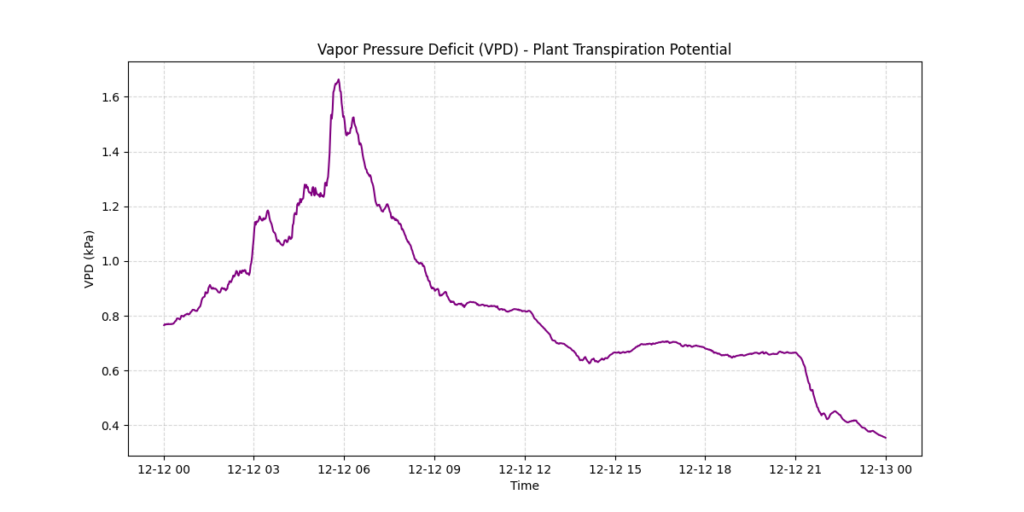
(See Figure 3: VPD Analysis)
Analysis: Our analysis shows the VPD fluctuating between 0.35 kPa and 1.66 kPa.
- The Sweet Spot: Most crops thrive in a VPD range of 0.4 to 1.2 kPa.
- Critical Insight: The data indicates periods where VPD spikes above 1.5 kPa. During these high-stress windows, plants close their stomata to save water, halting photosynthesis.
- Actionable Advice: By visualizing VPD, a farm manager knows exactly when to mist a greenhouse or irrigate to lower the stress, ensuring the plants keep growing at maximum capacity throughout the day.
3. Resource Efficiency: Soil Moisture & Light
Water is one of a farm’s biggest expenses. Irrigating based on a schedule is outdated; irrigating based on need is the future.
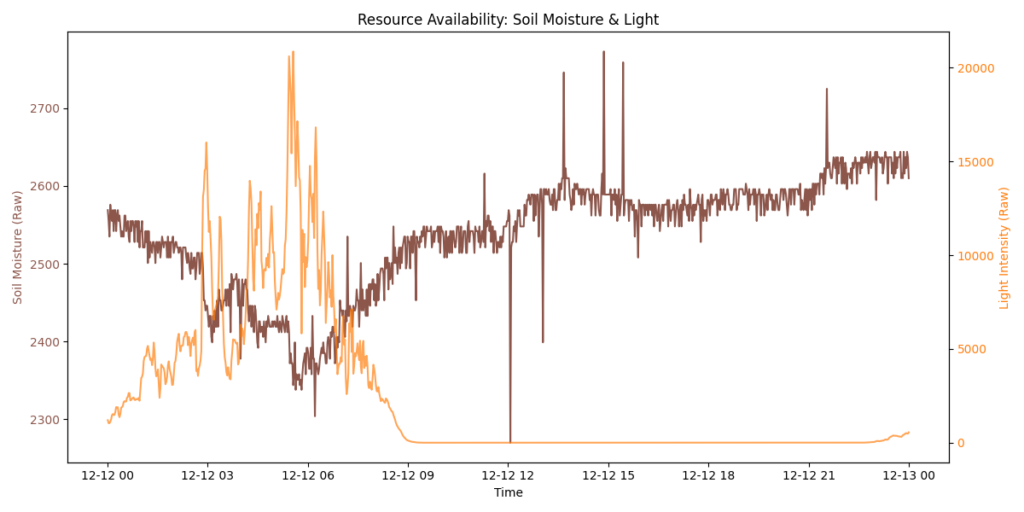
(See Figure 2: Resource Availability)
Analysis: We examined the correlation between Light Intensity (Orange) and Soil Moisture (Brown).
- Trend: There is a strong negative correlation (-0.95) between temperature/light and soil moisture raw values. As the sun hits its peak intensity, we can see the immediate drawdown in soil moisture levels as evaporation and plant uptake increase.
- ROI Moment: This chart answers the question: “Did I over-water?” By observing the slope of the moisture line, we can determine how fast the soil drains. If the line flattens out while the soil is still moist, you can delay the next irrigation cycle, saving significant water and energy costs.
Conclusion: From Data to Decisions
The charts above are not just pretty pictures; they are a dashboard for efficiency.
- Reduce Risk: Predict frost and disease.
- Increase Yield: Optimize VPD for maximum photosynthesis.
- Save Costs: Water only when the sensors say so.
In the era of Smart Farming, your data is just as valuable as your soil. Are you ready to listen to what your field is saying?
Technical Summary (For the Website Backend)
- Data Source: Node 0x1 (Dec 2025).
- Max Temp: 20.01°C | Min Temp: 9.29°C
- VPD Status: Occasionally high (>1.6 kPa), suggesting a need for humidity control during peak heat.
- Sensor Health: RSSI (Signal Strength) is stable at -73 dBm, indicating reliable connectivity.
Leave a Reply